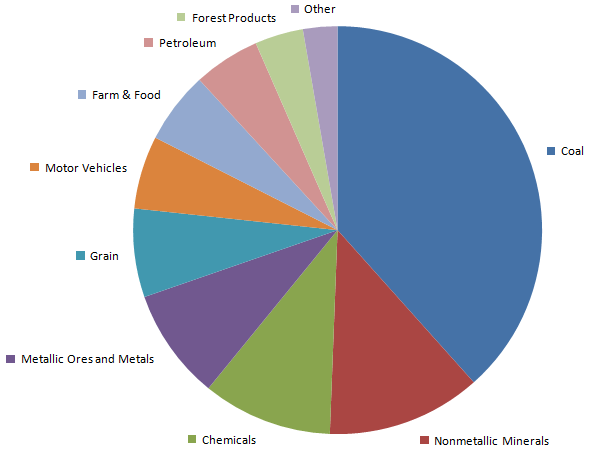
U.S. Freight Railroad Traffic
/ Commodity Mix
| This table presents U.S. freight rail
traffic by commodity group for calendar year 2014. Data was
compiled from Association of American Railroads (AAR) carloading
reports with charts and analysis by RailServe.com. See also:
State Railroad Statistics,
Rail Traffic Volume Statistics,
Railcar Statistics, and
Crude By Rail
Statistics
Note: This page is copyright © RailServe.com.
Content may not be reproduced in whole or in part on any website, message board, or other medium.
A link to this page is required when citing figures or charts. Please contact us
with any questions. |
| |
Commodities |
Carloads |
% of Total |
|
|
|
Coal |
5,824,280 |
38.4% |
|
|
|
Nonmetallic Minerals |
1,855,740 |
12.2% |
|
|
|
Chemicals |
1,562,442 |
10.3% |
|
|
|
Metallic Ores and Metals |
1,335,579 |
8.8% |
|
|
|
Grain |
1,062,035 |
7.0% |
|
|
|
Motor Vehicles and Parts |
876,792 |
5.8% |
|
|
|
Farm Products & Food (excludes Grain) |
864,088 |
5.7% |
|
|
|
Petroleum and Petroleum Products |
798,460 |
5.3% |
|
|
|
Forest Products |
582,894 |
3.8% |
|
|
|
All Other Carloads |
414,525 |
2.7% |
|
|
|
Total 2014 U.S. Carloads
(ex-intermodal) |
15,176,835 |
|
|
|
|
|
|
|
|
| |
Intermodal |
Units |
% of Total |
|
|
|
Intermodal Containers (COFC) |
11,950,000 |
88.5% |
|
|
|
Trailers (TOFC) |
1,550,000 |
11.5% |
|
|
|
Total 2014 Intermodal Units |
13,500,000 |
|
|
|
|

2014 Carload Commodity Mix (ex-intermodal) |
|
|

|

